Work
2023
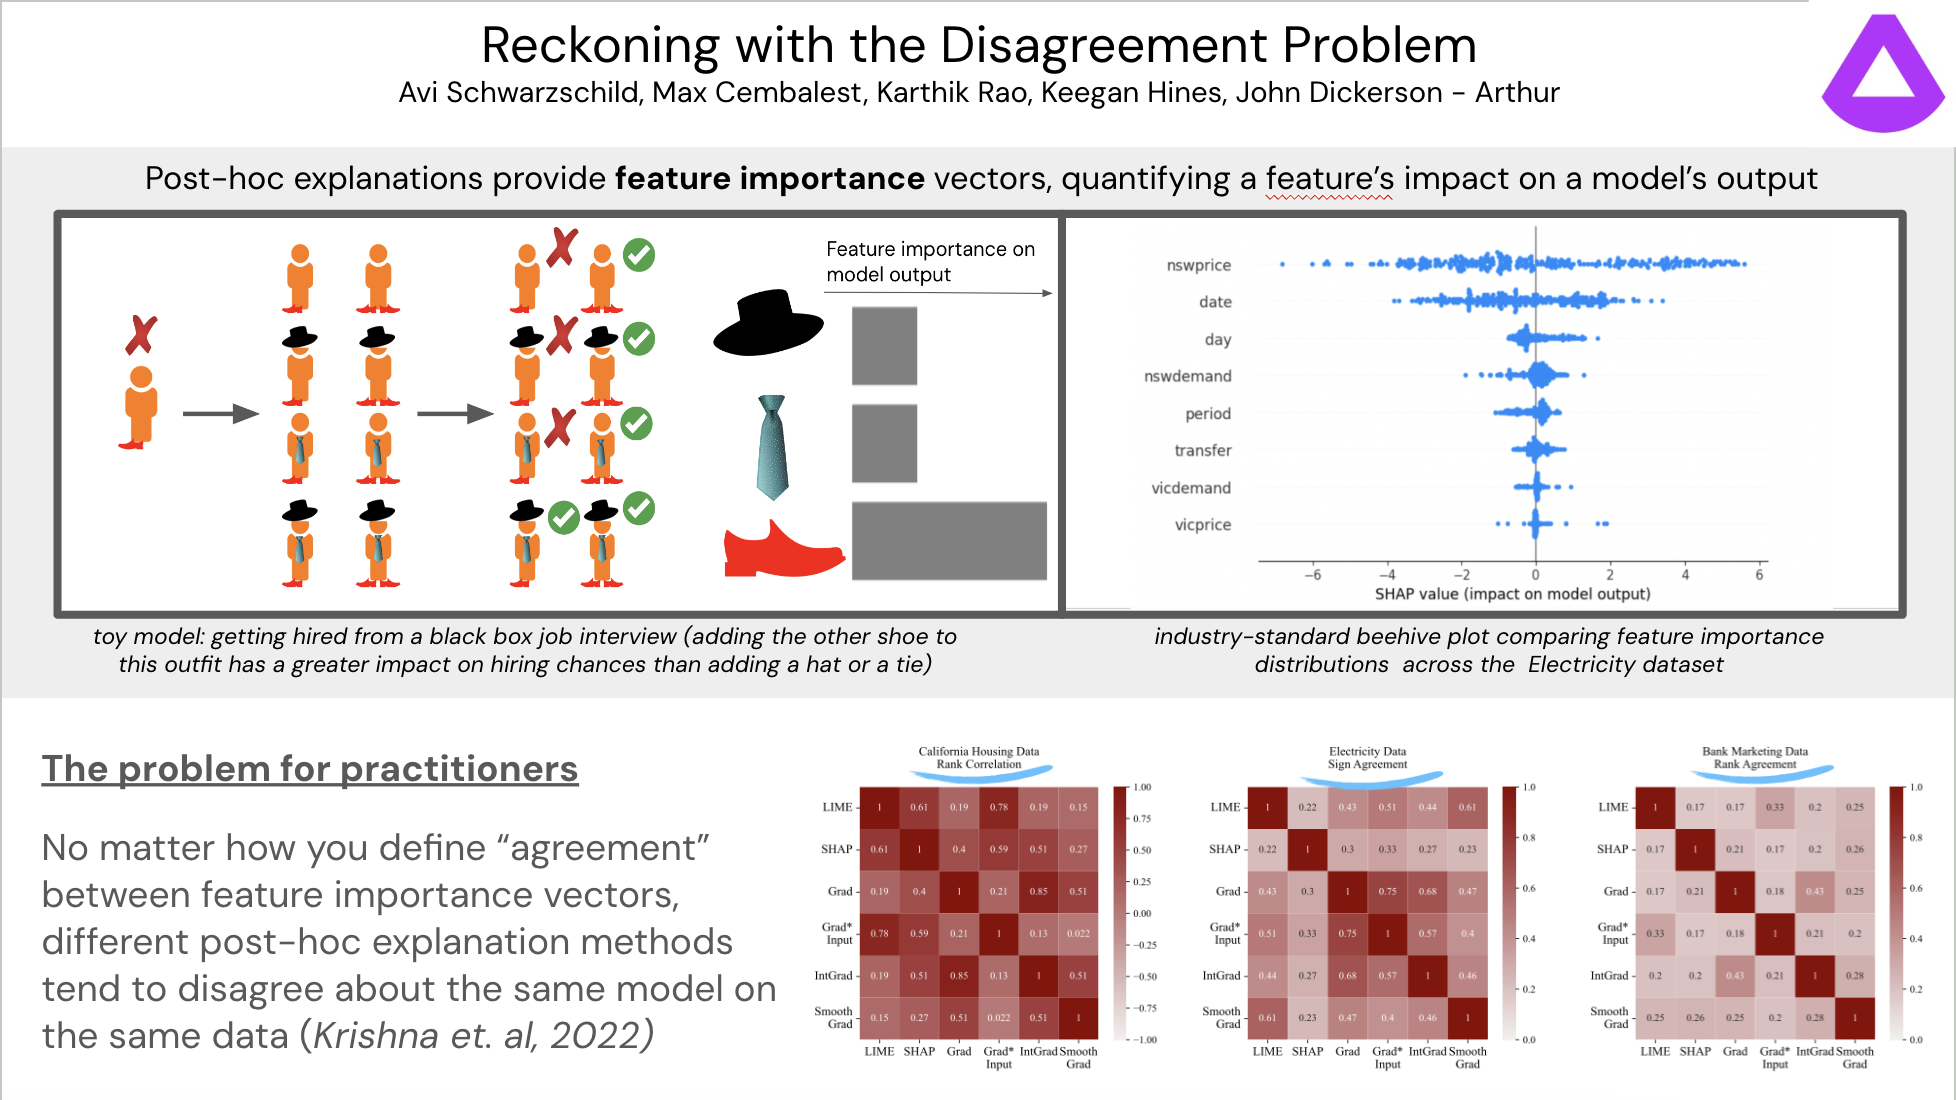
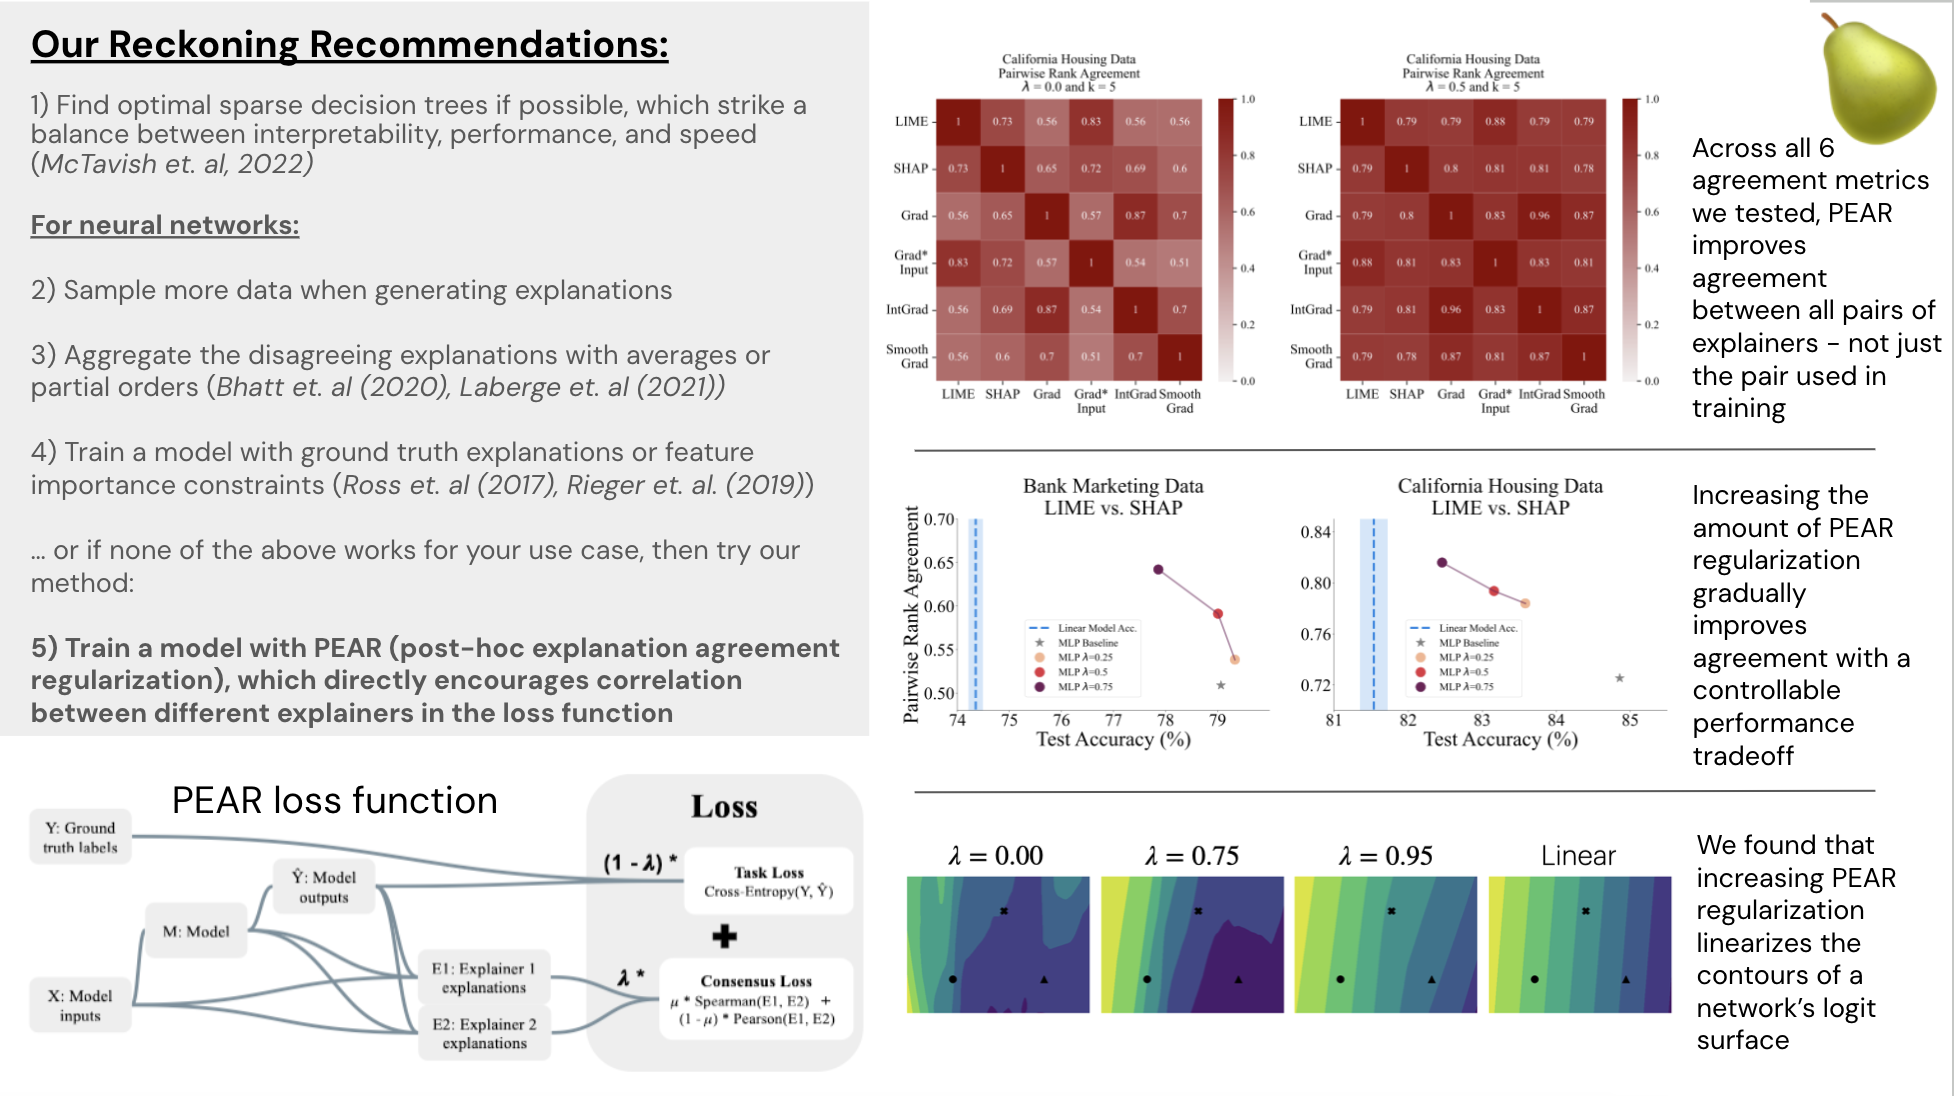
PEAR: Post-Hoc Explanation Agreement Regularization
In late 2022 and early 2023 colleagues and I from Arthur worked on studying the “Disagreement Problem” in explainable machine learning, which refers to the difficulty in getting consistent explanations of neural network behavior. We developed a method that improves the consistency of neural network explanations called PEAR. You can train any pytorch model with our regularizer by pip-installing pear-xai or cloning from our github repo.
Our paper on PEAR and the disagreement problem more broadly can be found on arxiv. I will be presenting my team’s work at the 2023 AAAI/ACM conference on Artificial Intelligence, Ethics, and Society in Montreal.
Pytorch Geometric GNN starter repository
I put together a starter github repo with all the requirements necessary to train graph neural networks (GNNs) using PyTorch Geometric.
Graph neural networks are a natural choice for data that exhibits a network structure. To demonstrate this in the starter repo, I load a dataset of the annual passenger “acitivty level” of each US airport (whether the airport was in the 1st, 2nd, 3rd, or 4th quartile of airports ranked by yearly passenger usage). The goal of this dataset is to train a model to predict that activity level. The available input feature set is connectivity graph of airports that have a flight from one to the other:
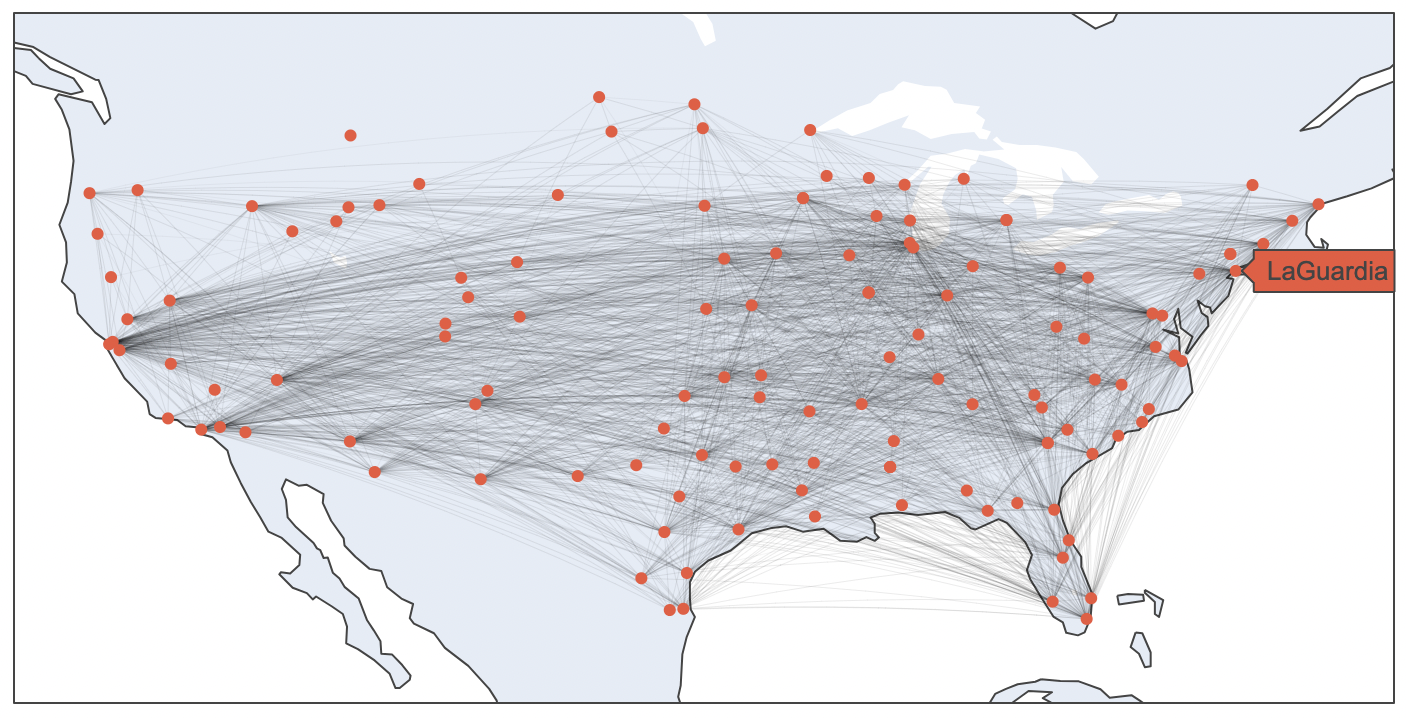
I first train a logistic regression model as a baseline, extracting the degree of each airport from the connectivity graph as the only input feature (the degree of an airport is the number of airports each airport has an available flight to). I get ~50% accuracy at predicting the activity level of each airport using this baseline model.
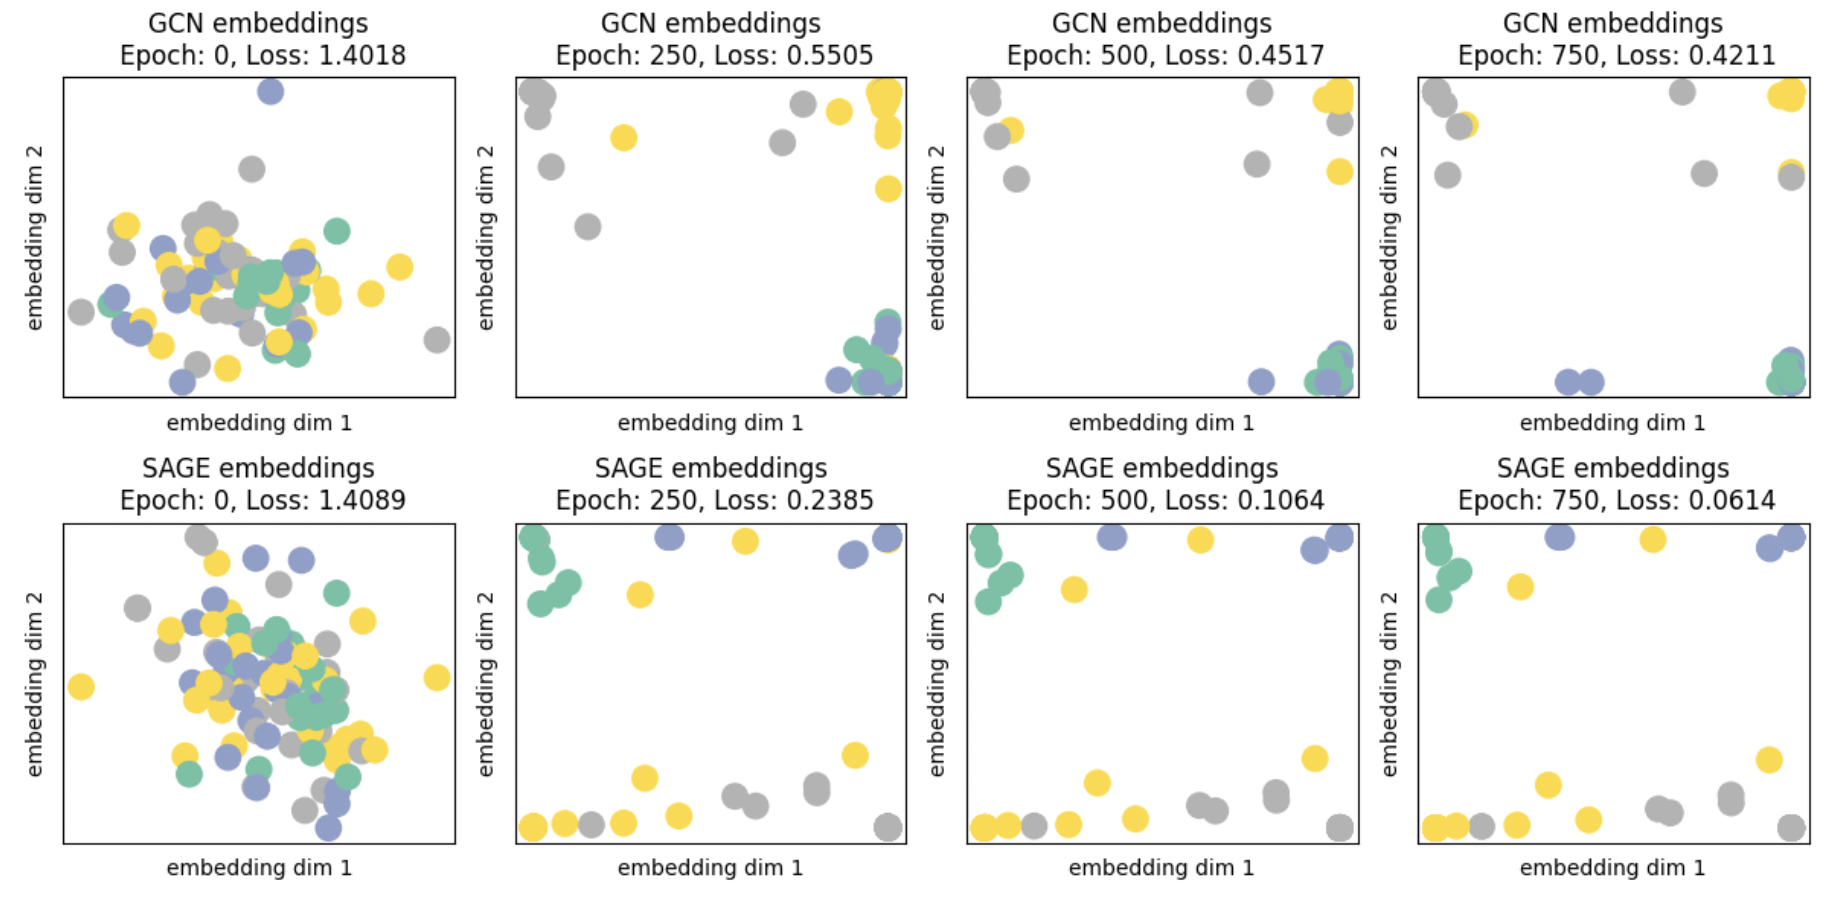
Then I train two kinds of GNNs (Graph Convolutional Network and GraphSAGE) using PyTorch Geometric and get between 75%-85% accuracy on the same dataset, this time using the connectivity graph directly as the input to the model.
In my notebook I include code for visualizing the last-layer GNN embeddings during training to qualitatively compare how the models are factoring the four classes of data. There are four classes of data, so the desired picture here would be for the dots to slowly group by color in the four corners of the embedding space for maximum separability - GraphSAGE does this better than GCN at this, and achieves lower loss in the process.
2022
Tutorial on Shapley Residuals
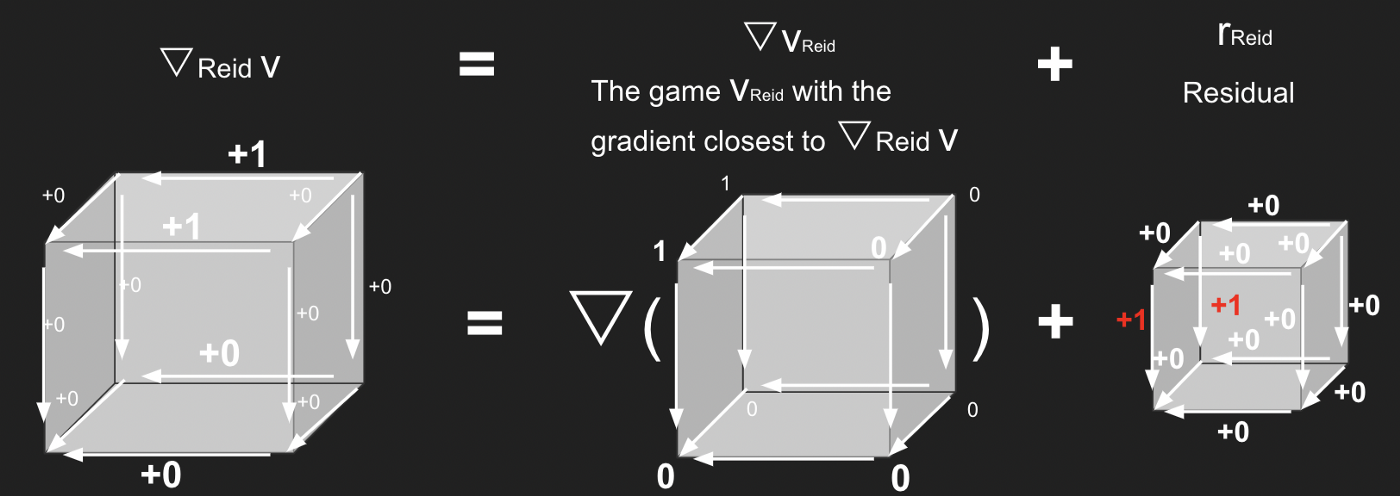
After my first few months researching machine learning interpretability & explainability at Arthur, I wrote a short explainer on Shapley values and a tutorial for calculating their residuals for TowardsDataScience based on the work of Kumar et. al..
This post is aimed at a general data science practitioner audience to explain the limitations of Shapley values at capturing feature importance for complex models.
Interactive Congressional Gerrymandering Explorer
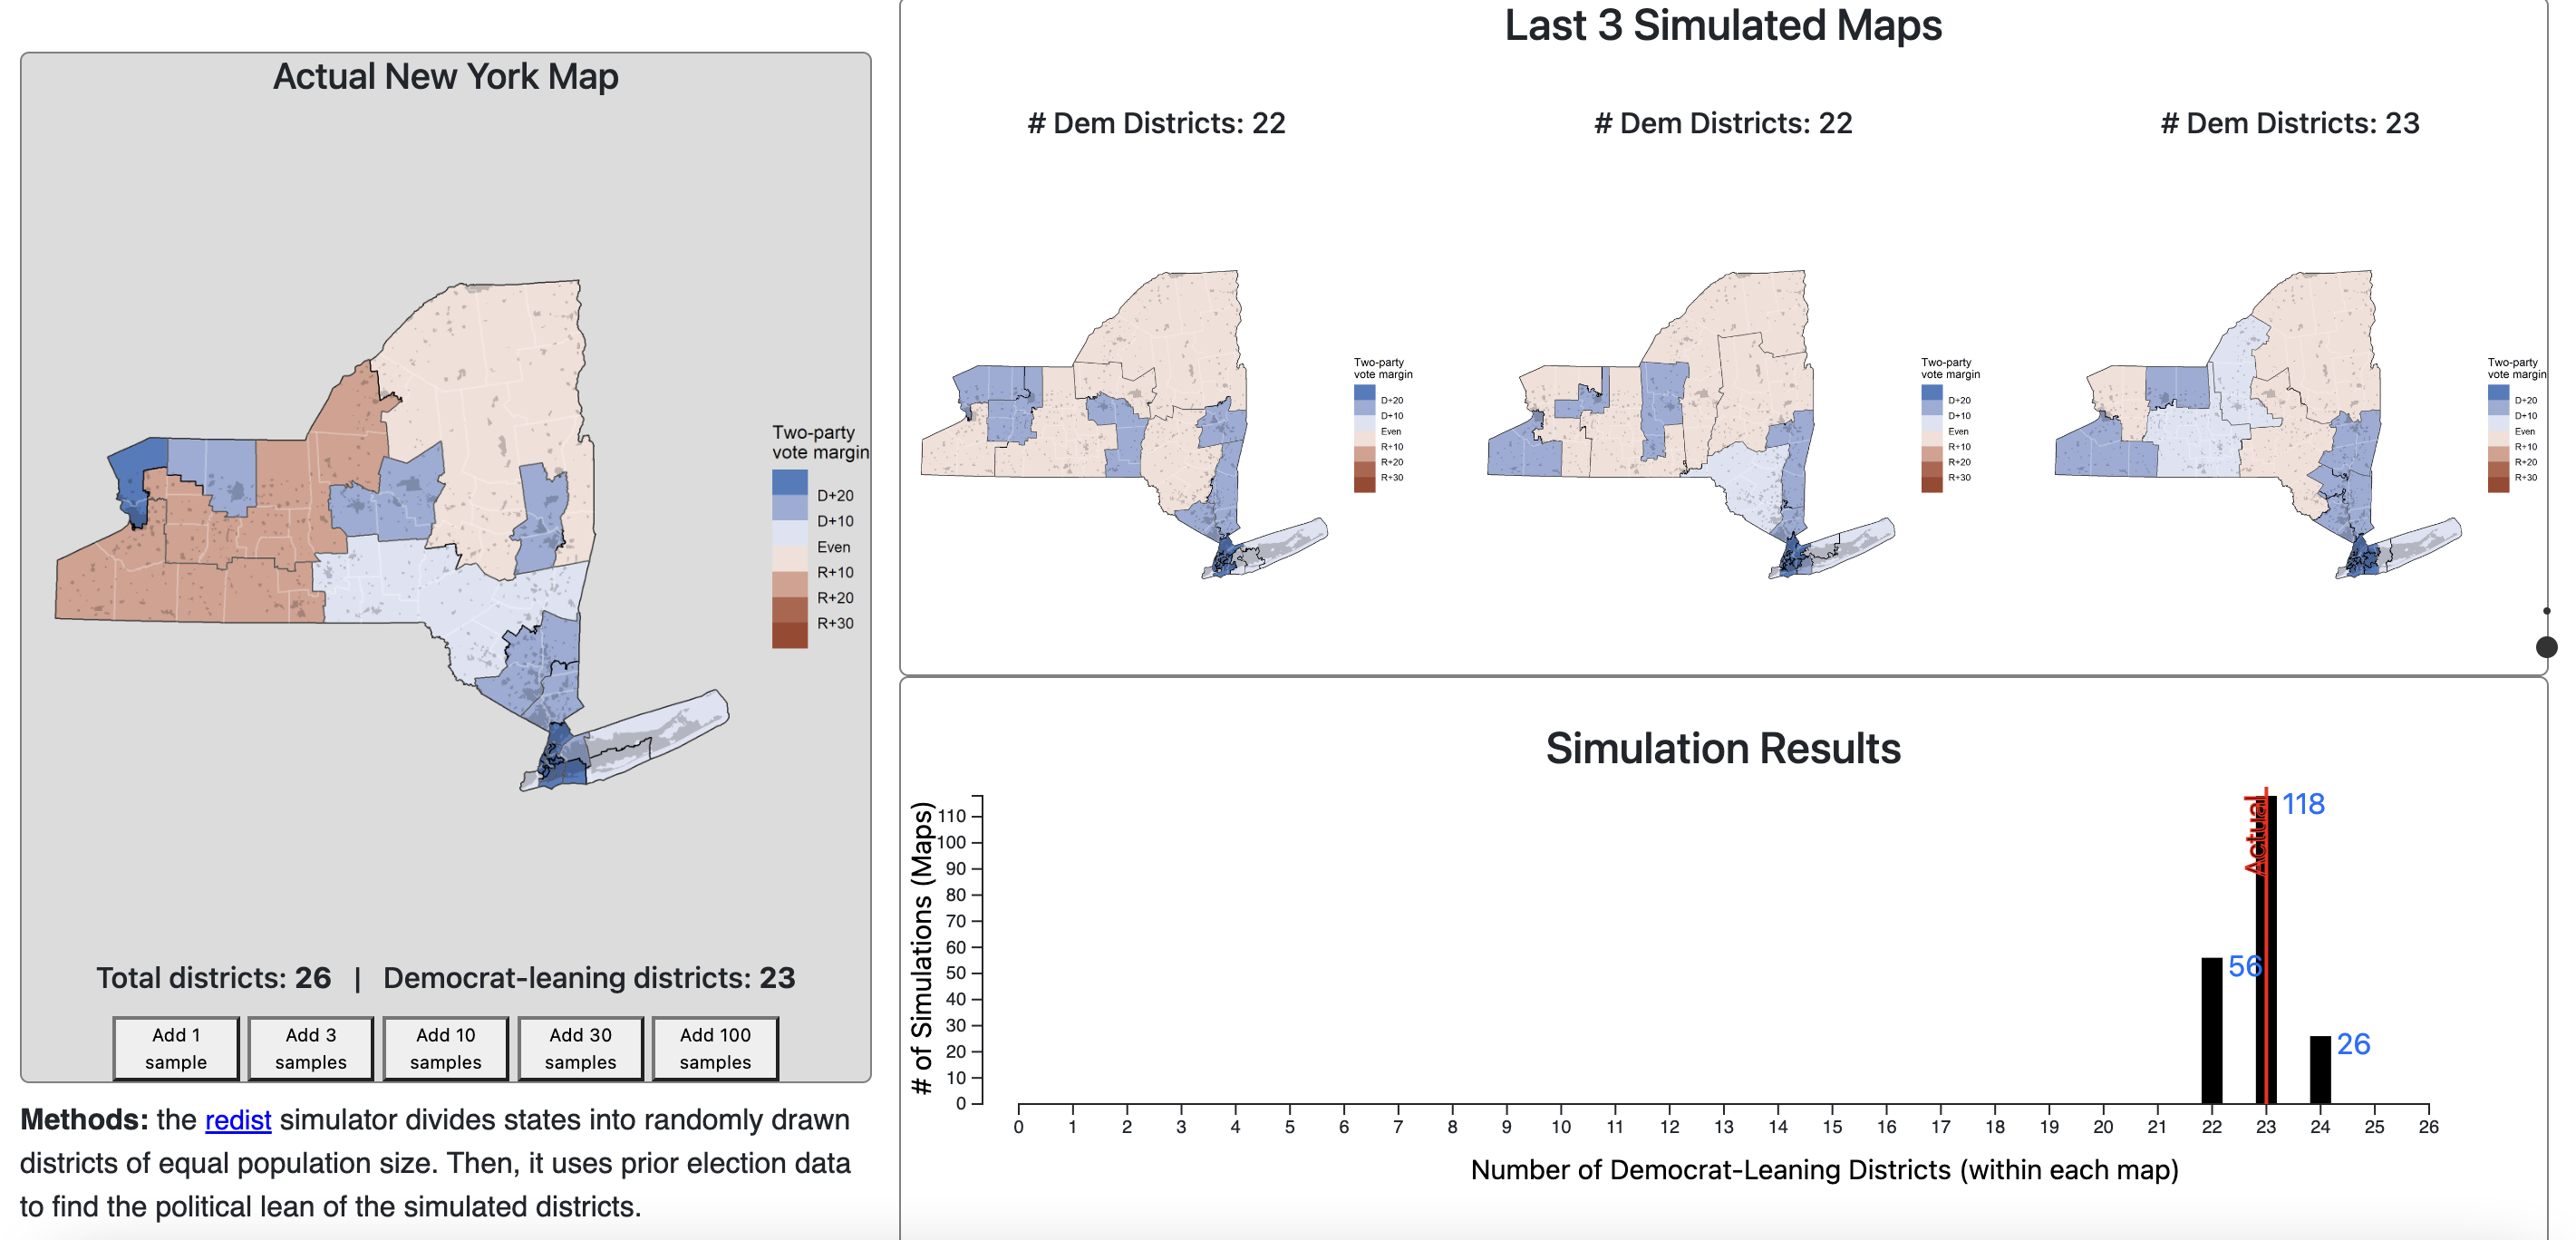
For Skew The Script, I co-developed an AP Statistics lesson on sampling and p-values, applied to the problem of evaluating the level of gerrymandering of congressional maps relative to the other valid maps that could have been drawn (using the redist simulator).
You can visit the interactive applet here and see how the current congressional map for your state compares to the distribution of other maps that could have been drawn!
2021
Geospatial Modeling for Lead Pipe Removal
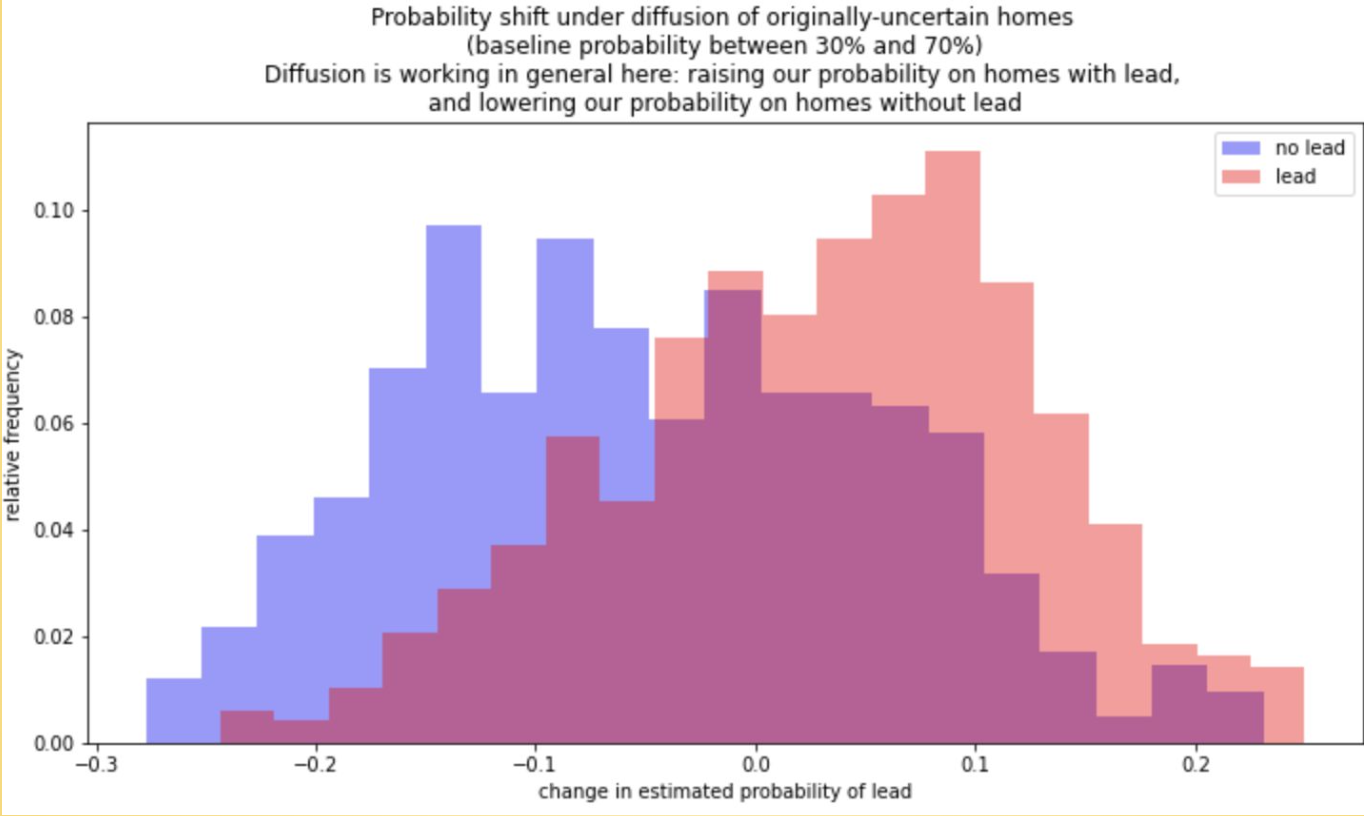
For my capstone research class, I worked with the organization BlueConduit on a project to improve their model’s performance at identifying lead in underground pipes serving water to homes in Flint, Michigan. They already had a well-performing XGBoost model in production, but wanted help identifying a more geospatially robust model to take advantage of the spatial nature of the problem - homes with lead in the water service line pipes tend to occur nearby each other.
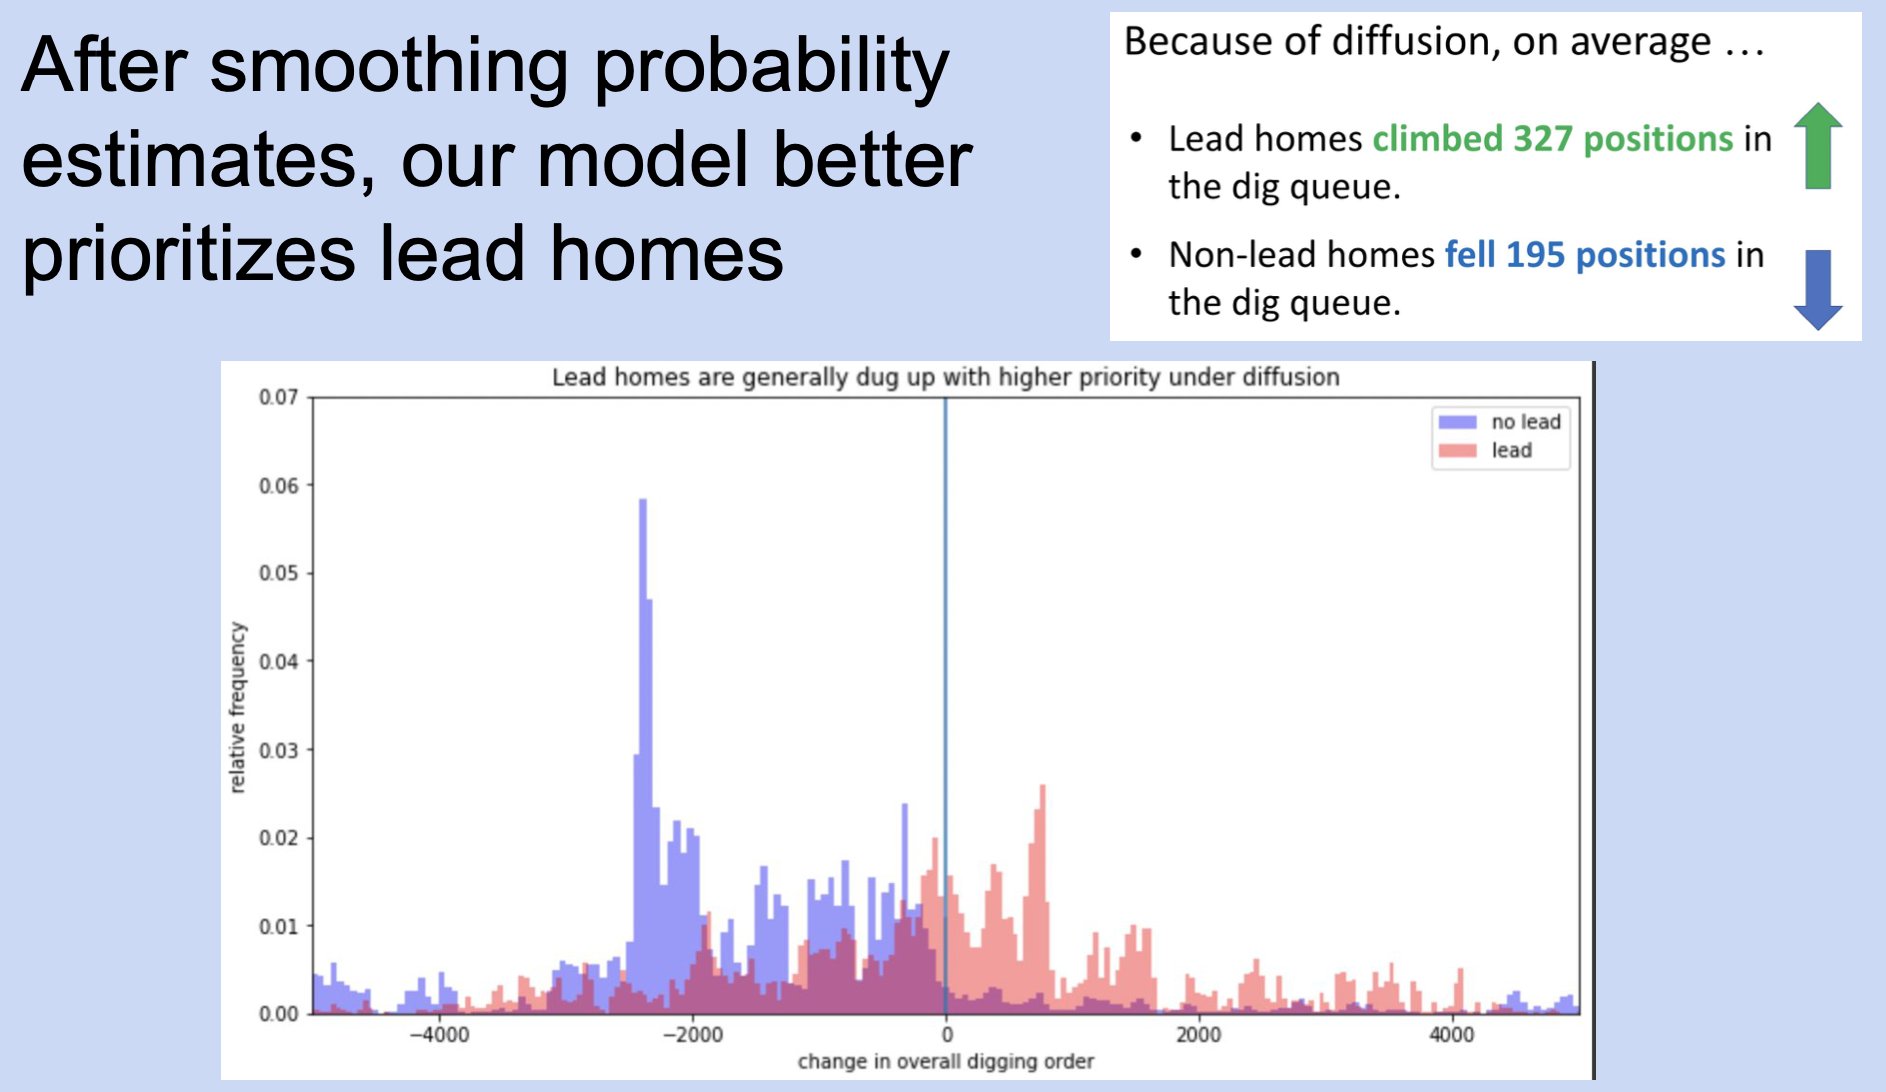
We took the baseline XGBoost model that BlueConduit had been using in production, and applied geospatial diffusion as a post-processing module to reduce the model’s overfitting of the probability each home has lead water pipes.
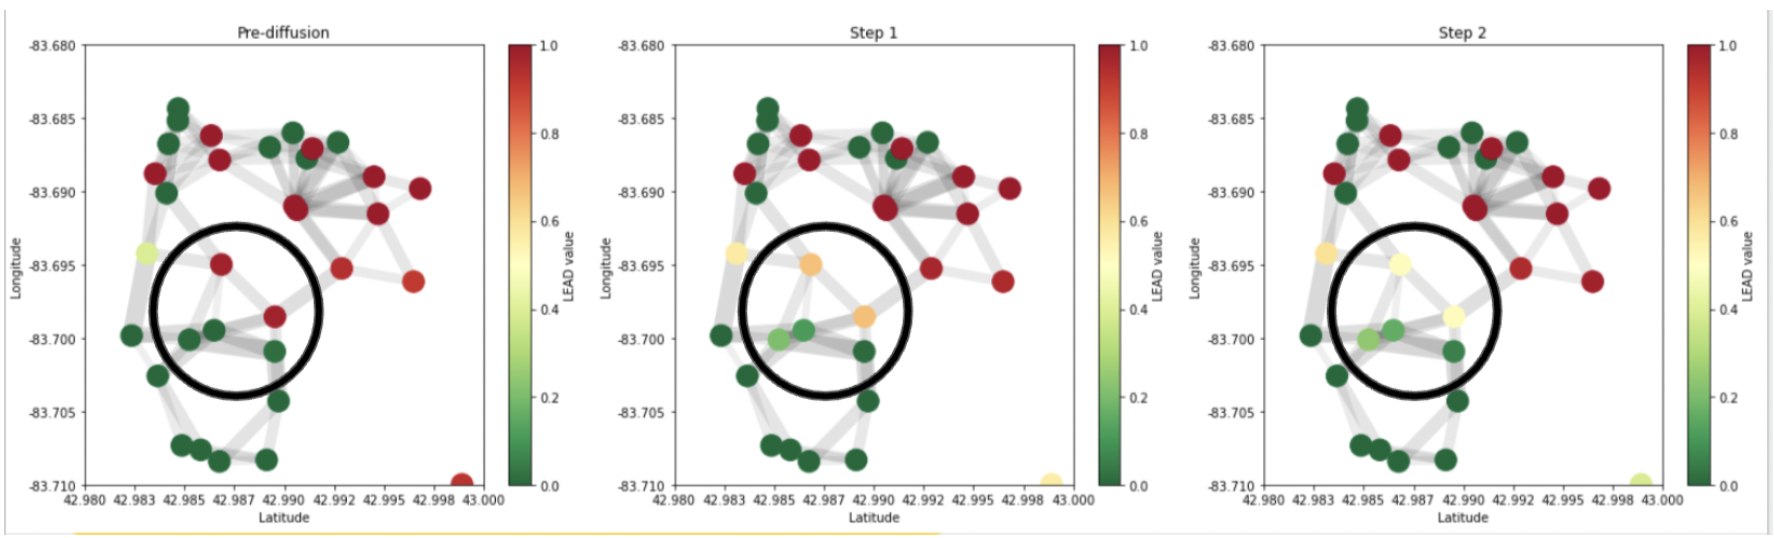
We conducted an assessment of our model against the baseline across the city and found that overall it performed better at prioritize predicting homes with lead to be dug up earlier in the digging queue than homes without lead.